
How to Monitor CPU Temperature in MSI Afterburner (Step by Step Setup)
Last updated:
I use MSI Afterburner for hardware monitoring, and yes, CPU temp is off by default. Here’s how I check CPU temp in MSI Afterburner fast.
- Open MSI Afterburner.
- Click Settings.
- Go to the Monitoring tab.
- Find and select CPU Temperature.
- Check Show in On-Screen Display (OSD).
- Click Apply.
Make sure RivaTuner Statistics Server is installed for the overlay. The readings come from motherboard and CPU sensors. If temps go above 90°C under load, cooling may be weak. You can compare cooling options in detail in this guide on air vs liquid cooling. Once done, the overlay appears in-game.
Does MSI Afterburner Support CPU Temperature Monitoring?
MSI Afterburner hardware monitoring mainly focuses on GPU overclocking and tracking. But CPU temperature support exists. According to official MSI documentation on the MSI Afterburner page, the software reads data through monitoring plugin modules and external sensor sources. It pulls values from motherboard sensors, SMBus, or embedded controller sensors when supported.
What MSI Afterburner Can Monitor
- GPU temperature
- GPU usage
- Fan speed
- Voltage
- CPU temperature if supported via external sensor source
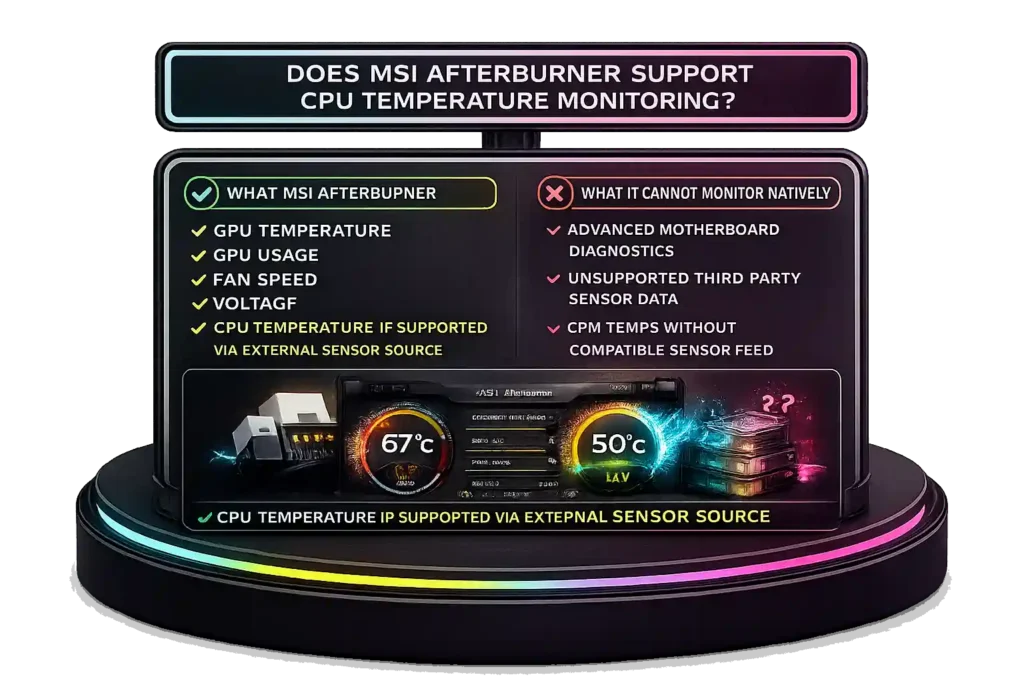
What It Cannot Monitor Natively
- Advanced motherboard diagnostics
- Unsupported third-party sensor data
- CPU temps without compatible sensor feed
CPU temps may not show because monitoring is disabled, the sensor is not detected, or motherboard compatibility limits access. Some AMD and Intel chipsets expose sensor data differently, so extra configuration or plugin activation may be required, as stated in official MSI documentation.
How to Turn On CPU Temperature in MSI Afterburner
MSI Afterburner is mainly for GPU tuning, but you can enable CPU temperature in MSI Afterburner too. CPU temp is disabled by default. The readings come from motherboard and CPU digital thermal sensors. Most CPUs stay between 60–85°C during gaming. If you’re planning a new setup, this guide explains how to build a custom PC with proper thermal balance.
- Open MSI Afterburner.
- Click the Settings gear icon.
- Go to the monitoring tab.
- Scroll down and find the CPU temperature option.
- Click it to complete the CPU sensor selection.
- Check Show in On-Screen Display.
- Click Apply.
Make sure RivaTuner Statistics Server is running for the OSD overlay to work. Launch a game to confirm the overlay appears.
How to Display CPU Temperature In-Game Using RTSS Overlay
RivaTuner Statistics Server runs the MSI Afterburner OSD. It creates the hardware monitoring overlay you see in games. RTSS must be installed and running in the system tray. It uses a low level graphics API hook like DirectX, OpenGL, or Vulkan, so performance impact usually stays under 1 to 2 percent. If you’re unsure how performance metrics differ from storage measurements, read this guide on gigabit vs gigabyte.
- Open MSI Afterburner.
- Enable CPU Temperature and click Show in On-Screen Display.
- Open RTSS.
- Set On-Screen Display support to ON.
The overlay works in fullscreen and borderless modes.
You can change label text, adjust color, move screen position, and set zoom size inside RTSS.
Launch a game to confirm the overlay appears.
Fix MSI Afterburner CPU Temperature Not Showing
Sometimes MSI Afterburner not showing CPU temp happens because of a sensor detection issue or plugin problem. CPU readings depend on motherboard sensor exposure and proper configuration.
- Open Settings → General and enable low-level I/O driver. This allows deeper sensor detection.
- Go to Settings → Monitoring and make sure the CPU.dll plugin is active. This plugin handles CPU sensor data.
- Delete old profiles if you upgraded from AM4 to AM5. AM5 boards use newer sensor mapping, and older configs may cause conflicts.
- Install the latest or Beta version for better Ryzen 7000 support. Advanced Micro Devices changed sensor handling in newer Ryzen architectures.
- Restart MSI Afterburner or reboot your PC to refresh hardware monitoring.
Also, update your BIOS if needed, since firmware updates often improve monitoring compatibility.
The CPU sensor should now appear in the Monitoring tab.
Using HWiNFO with MSI Afterburner for Advanced CPU Monitoring
If MSI Afterburner does not detect your CPU sensor, I use HWiNFO for extended sensor access. HWiNFO provides shared memory support, which allows third-party overlay integration with tools like Afterburner. According to official HWiNFO documentation on hwinfo.com/forum, shared memory exposes sensor data for external applications.
- Install and open HWiNFO. Run it in Sensors-only mode.
- Go to Settings and enable HWiNFO shared memory support.
- Open MSI Afterburner.
- Go to the Monitoring tab.
- Enable MSI Afterburner HwInfo.dll plugin.
- Select the CPU sensor and enable Show in On-Screen Display.
- Keep HWiNFO running in the background while gaming.
On Ryzen chiplet monitoring systems like Ryzen 7000 and 9000, you will see Tctl vs CCD temperature values. Tctl/Tdie shows overall CPU package temperature and controls fan behavior. CCD1 shows individual chiplet temperature. Tctl may include a small offset for thermal control, so I monitor Tctl for overall thermals.
Which CPU Temperature Reading Is Most Accurate to Monitor?
Intel thermal specifications explain that every processor has a Tjunction Max value. Intel official documentation states that TjMax temperature is the maximum safe limit before thermal throttling starts. Most modern Intel CPUs list TjMax between 95°C and 105°C. When the CPU approaches this thermal throttling limit, it automatically reduces clock speed to prevent damage.
Core vs Package Temp
Core temperature shows each physical core reading. CPU package temperature shows the overall die temperature. For general monitoring, package temperature gives a clearer picture.
Physical vs Hyper-Threading
Logical cores do not have separate sensors. Only physical cores report temperature.
Highest vs Average
Highest core temperature triggers throttling. I monitor highest core or package temp. Sustained temps above 90°C may reduce silicon lifespan.
Is 80–90°C CPU Temperature Normal or Dangerous?
I get this question a lot. According to Advanced Micro Devices official thermal documentation on amd.com CPU thermal FAQ, modern Ryzen processors are designed to run at higher temps under load. Many Ryzen 5000 and 7000 chips list a TjMax temperature around 95°C before throttling. So 80–90°C can be normal depending on cooling and workload.
Normal Temperature Ranges
- Idle: 30–45°C
- Light tasks: 40–60°C
- Gaming CPU temperature: 70–85°C
- 85–90°C: High but often within safe CPU temperature range
- 95°C+: Near Ryzen thermal limit
When Thermal Throttling Starts
CPUs begin CPU thermal throttling near TjMax temperature. Ryzen 7000 series boosts aggressively until about 95°C by design. Sustained 90°C+ may mean cooling limits. If your system struggles with heat, it may be time to upgrade your PC components. Over many years, constant high heat can slightly wear silicon faster.
Quick Ways to Reduce CPU Overheating
- Improve airflow (especially if using vertical mounting, read the pros and cons of vertical GPU installation here)
- Reapply thermal paste
- Adjust fan curve
- Undervolt if experienced
- Clean dust from heatsink
Best MSI Afterburner Alternatives for Monitoring CPU Temperature
Sometimes I use other CPU temperature monitoring software when I need deeper sensor data. MSI Afterburner works, but dedicated hardware monitoring alternatives can give more detailed readings.
1. HWiNFO
HWiNFO provides advanced sensor monitoring. It shows per-core temperature tool data, CCD readings, voltage, and power values. It reads Digital Thermal Sensors inside modern CPUs for accurate results. It also supports shared memory overlays. Many benchmarking and overclocking users rely on HWiNFO for detailed chipset compatibility.
2. Core Temp
Core Temp is lightweight and simple. It displays per-core temperature and shows TjMax monitoring data. It focuses only on CPU thermal readings, which makes it easy for quick checks.
3. Windows Task Manager
According to Microsoft support documentation at support.microsoft.com/windows, Task Manager shows CPU usage, clock speed, and utilization. It does not provide per-core temperature monitoring. Windows Task Manager CPU limits restrict it to basic performance data.
4. AMD and NVIDIA Overlays
AMD Adrenalin shows CPU and GPU metrics but with limited thermal detail. NVIDIA GeForce Experience focuses mainly on GPU stats.
Task Manager lacks CPU temperature data and overheating diagnostics.
FAQs
How to see CPU temperature in MSI Afterburner?
Open MSI Afterburner. Click Settings, then go to the Monitoring tab. Select CPU Temperature and check Show in On-Screen Display. Click Apply. Make sure RivaTuner Statistics Server is running so the OSD appears in-game.
Why doesn’t Afterburner show CPU temperature?
Usually it’s a sensor detection issue. CPU monitoring may be disabled, the CPU.dll plugin may not be active, or the motherboard sensor is not exposed. Some AM5 and newer Intel boards need updated versions for proper hardware monitoring.
How do I view CPU temperature?
You can use MSI Afterburner, HWiNFO, or Core Temp. These tools read the CPU’s Digital Thermal Sensors. Windows Task Manager does not show CPU temperature.
Is MSI Afterburner CPU temperature accurate?
Yes, it reads data from motherboard and CPU sensors. Accuracy depends on sensor reporting and chipset support.
Is 40 C too hot for a GPU?
No. 40°C is normal at idle. Most GPUs operate safely up to 80–85°C under load.
Is 42 C hot for CPU?
No. 42°C is normal for idle or light tasks. Gaming temps usually range between 60–85°C.