
This Pixel Density Calculator computes pixel density using screen resolution and screen size in inches or centimeters. It determines display sharpness for monitors, TVs, mobile phones, and tablets based on display resolution and physical size.
Pixels per inch measures how many pixels fit into one inch of a screen. Pixels per centimeter measures how many pixels fit into one centimeter. Higher pixel density increases display sharpness. A 24 inch 1920×1080 monitor provides about 92 pixels per inch, while a 27 inch 4K resolution 3840×2160 display provides about 163 pixels per inch. Many smartphones exceed 300 pixels per inch, often referred to as Retina level density.
The calculator uses the formula:
PPI = √(width² + height²) ÷ screen size in inches.
One inch equals 2.54 centimeters.
If inches are entered, the tool calculates pixels per inch. If centimeters are entered, it calculates both pixels per inch and pixels per centimeter.
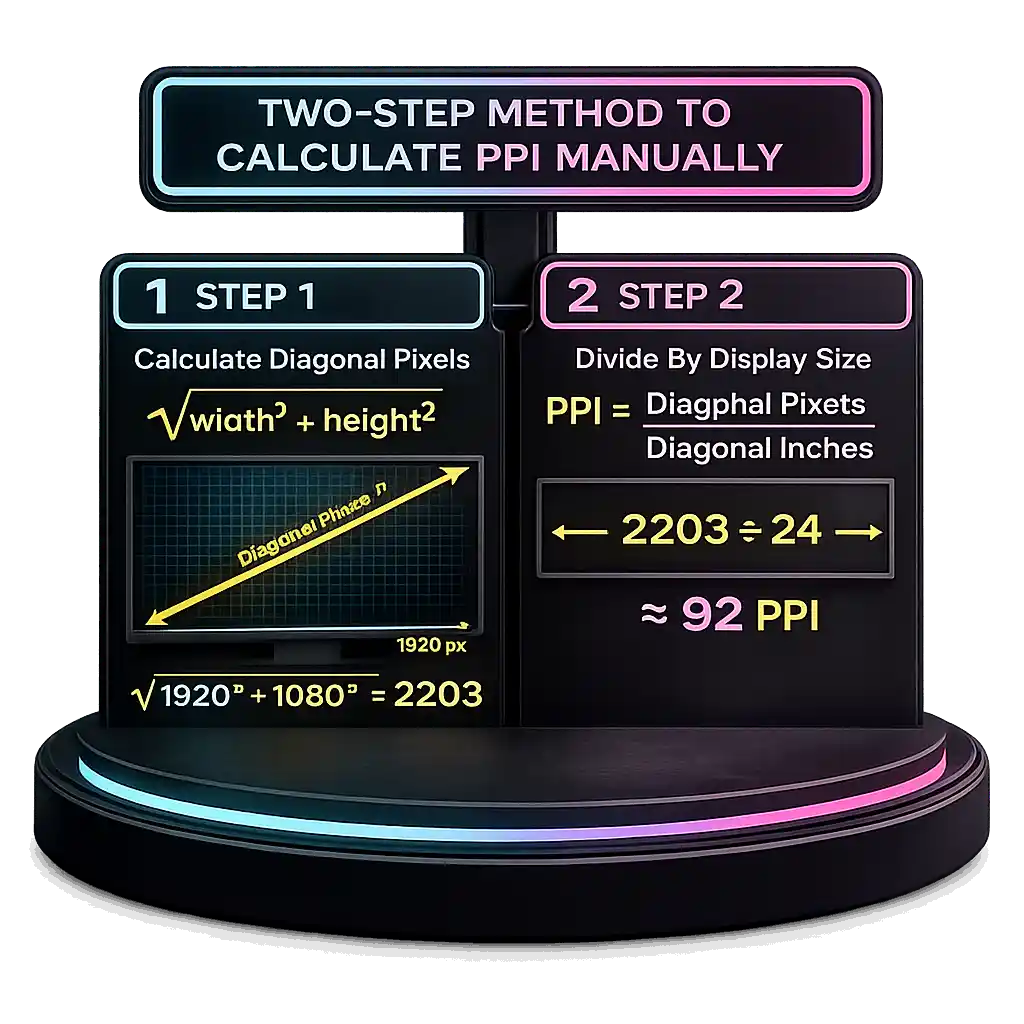
Two-Step Method to Calculate PPI Manually
This section explains how to calculate PPI using a simple resolution calculation method.
- Calculate the diagonal in pixels using the Pythagorean theorem.
Formula:
√(width² + height²)
Width and height are the pixel dimensions of the screen resolution. For example, a 1920×1080 display uses 1920 pixels for width and 1080 pixels for height.
√(1920² + 1080²) ≈ 2203 diagonal pixels.
- Divide the diagonal in pixels by the display size in inches.
Formula:
PPI = diagonal pixels ÷ diagonal inches
For a 24 inch display:
2203 ÷ 24 ≈ 92 PPI.
PPI measures how many pixels fit into one linear inch. Because modern LCD, LED, and OLED panels use square pixels, the same pixel density applies horizontally, vertically, and diagonally. This pixel density formula works for nearly all modern displays.
To calculate pixels per centimeter, use the same method but divide by screen size in centimeters. One inch equals 2.54 cm.
How to Calculate PPI² (Pixels per Square Inch) & Dot Pitch
Pixels per square inch, written as PPI², measures pixel area density. It tells how many pixels fit inside a 1 inch × 1 inch area. Linear PPI measures pixels in one line. PPI² measures pixels in total area.
PPI² Formula
PPI² = PPI × PPI
If using centimeters, replace inches with centimeters to calculate pixel area density per cm².
Worked Example: Linear PPI Calculation
Given:
Resolution = 1920 × 1080
Display size = 10 inches
Step 1: Calculate diagonal resolution using the Pythagorean theorem
√(1920² + 1080²)
= √(3,686,400 + 1,166,400)
= √4,852,800
= 2202.91 pixels
Step 2: Divide by diagonal inches
PPI = 2202.91 ÷ 10
= 220.29 PPI
Final result:
→ 220.29 pixels per linear inch
PPI² Example
220.29² = 48,528 pixels per square inch
This means a 1 inch × 1 inch area contains about 48,528 pixels.
How to Calculate Diagonal Dot Pitch (mm)
Diagonal dot pitch measures the distance from the center of one pixel to the next pixel diagonally. It shows pixel spacing in millimeters per pixel and directly relates to pixel density and display sharpness.
Formula:
Dot Pitch = (Diagonal Inches ÷ Diagonal Pixels) × 25.4
One inch equals 25.4 mm.
Example calculation:
- Given diagonal size = 15.4 inches
- Given diagonal resolution = 3396 pixels
- Apply the formula
(15.4 ÷ 3396) × 25.4 ≈ 0.1152 mm
Final result:
Diagonal dot pitch ≈ 0.1152 mm per pixel.
Higher pixel density improves image sharpness and detail clarity, while smoother motion can be evaluated separately using our refresh rate test to measure display performance. Many 24 inch 1080p monitors measure around 0.27 mm. Dot pitch and PPI are inversely related, and can also be estimated using:
Dot Pitch ≈ 25.4 ÷ PPI
How to Calculate Screen Aspect Ratio (Step by Step)
Aspect ratio shows the width to height ratio of a screen in lowest terms. It represents the proportional relationship between screen dimensions. It does not measure screen resolution quality. For example, 1280×720 and 3840×2160 are both 16:9 resolution, but they contain very different pixel counts.
Step by Step Example
Given screen resolution: 1920 × 1080
- Write the width to height ratio
1920:1080 - Find the GCF using the GCF method
The greatest common factor of 1920 and 1080 is 120 - Divide both numbers by 120
1920 ÷ 120 = 16
1080 ÷ 120 = 9
Final aspect ratio = 16:9
Decimal Ratio Format
Divide both numbers by the height:
1920 ÷ 1080 ≈ 1.78
1080 ÷ 1080 = 1
Decimal form = 1.78:1
This display ratio means the screen is 1.78 times wider than it is tall.
The 16:9 aspect ratio became the global HDTV standard in the early 2000s when digital broadcasting expanded worldwide. Older displays commonly used the 4:3 aspect ratio. Ultrawide 21:9 displays provide wider screen space, and some laptops use a 3:2 display ratio for extra vertical space.
PPI Explained: Meaning, Use & Limitations
PPI definition refers to pixels per inch. It measures pixel density along a one inch line on a screen. It applies to display technology such as smartphone display panels, monitors, tablets, and printed photos. Higher pixels per inch increase screen sharpness and display clarity because more pixels fit into the same physical space.
Modern screens use square pixels, so pixel density remains equal on the horizontal and vertical axis. Pixel density formula calculations assume square pixels. Pixel area density, sometimes written as PPI², represents pixels per square inch of surface area. Most smartphones today exceed 300 to 500 PPI, which is considered high density at normal handheld viewing distance. In professional printing, 300 PPI is widely used for high quality photo output.
Why Physical Size Matters
Pixels per inch requires physical dimensions. A digital image resolution file alone does not have a fixed PPI. The same image can appear sharper or softer depending on screen size, zoom level, and viewing distance. Physical screen size determines actual pixel density.
Apple explains that high pixel density displays make individual pixels indistinguishable at normal viewing distances. According to Apple’s Retina Display Overview, “high pixel density displays are those where pixels become indistinguishable at typical viewing distances.”
PPI Calculation Formulas & Pixel Density Equations
PPI formula calculations use screen resolution and diagonal size. Pixel density calculation applies to inches or centimeters. The process first determines diagonal resolution, then divides by physical screen size.
Diagonal Pixel Formula
dₚ = √(w² + h²)
• w = horizontal pixels
• h = vertical pixels
This screen resolution formula comes from the Pythagorean theorem. It calculates diagonal resolution in pixels.
PPI Formula
PPI = dₚ ÷ dᵢ
Where dᵢ is the diagonal size in inches.
If centimeters are used, the result becomes pixels per centimeter.
1 inch equals 2.54 cm.
If width and height in inches are entered instead of diagonal, the calculator computes the diagonal internally. Physical dimensions and display resolution must follow the same aspect ratio consistency to avoid distortion errors.
Megapixels & Pixel Density
Total pixel count = w × h
Megapixels (Mpx) = (w × h) ÷ 1,000,000
This measures total pixel count, not linear density. Pixels per square inch measure area density.
For example, 3840 × 2160 equals 8.29 megapixels, commonly known as 4K UHD.
PPI can also be expressed as:
PPI ≈ 25.4 ÷ dot pitch (mm)
Dot Pitch Explained: Meaning, Relevance & Difference from PPI
Dot pitch definition refers to the distance between the centers of two adjacent pixels. It measures pixel spacing, not pixel count. Dot pitch is the inverse of PPI.
Dot Pitch (inches) = 1 ÷ PPI
Dot Pitch (mm) ≈ 25.4 ÷ PPI
Because 1 inch equals 25.4 millimeters, the millimeters per pixel value can be calculated directly from pixel density.
PPI measures how many pixels fit into one inch. Dot pitch measures how far apart those pixels are. Higher pixel density means lower dot pitch. Lower dot pitch increases display sharpness because pixels sit closer together.
Historically, CRT monitor specifications listed dot pitch more often than PPI. Many CRT displays ranged between 0.28 mm and 0.39 mm. These values corresponded to lower screen resolution and pixel density under 100 PPI. Modern display technology changed this. Smartphones often exceed 300 to 500 PPI, producing dot pitch values below 0.08 mm.
For example, a 24 inch 1080p monitor at about 92 PPI has dot pitch near 0.276 mm. A 6 inch smartphone at 450 PPI has dot pitch near 0.056 mm.
As pixel density increased, dot pitch numbers became very small and less intuitive. Industry terminology shifted toward PPI because it is easier to compare across devices.
PPI applies to digital displays. DPI vs PPI differences matter in printing. DPI refers to physical ink dots per inch. Printers commonly operate at 300 DPI or 600 DPI. One image pixel can require multiple ink dots for reproduction, so DPI and PPI are related but not technically identical.
DPI Explained: Difference Between DPI and PPI
DPI definition refers to dots per inch. It measures how many physical ink dots a printer places within one inch on paper. PPI means pixels per inch and measures pixel density on a digital screen. DPI applies to print resolution. PPI applies to image resolution on displays. They are related but not always equal.
PPI describes screen pixel density. DPI describes printer dot density. A screen pixel is a digital unit. A printer may use multiple ink dots to reproduce one pixel. Modern screens often approximate one pixel to one display dot, but printers do not follow a strict 1:1 relationship.
Worked Example
Given image resolution: 1800 × 2800 pixels
Total pixels = 5,040,000 (≈ 5.04 megapixels)
- Calculate diagonal pixels
√(1800² + 2800²) ≈ 3328.66 pixels - Print diagonal size = 6 inches
- Calculate PPI
3328.66 ÷ 6 ≈ 554.78 PPI
If printed on a 300 DPI printer, the printer becomes the limiting factor because 300 dots per inch cannot fully reproduce 554.78 pixels per inch. If printed on a 1000 DPI printer, multiple ink dots can represent each pixel, increasing tonal accuracy.
Professional photo printing commonly uses 240 to 300 DPI. High end printers may support 600 to 1200 DPI. Aligning printer DPI with image PPI in clean multiples reduces interpolation artifacts. Beyond 300 PPI, visible print improvement becomes minimal at normal viewing distance.
HP explains that DPI refers to printer dots, while PPI refers to screen pixels and image resolution.
Example: Calculating PPI, Megapixels & Dot Pitch
Consider a 5 inch smartphone display with a screen resolution of 640 × 480 pixels. The following steps show the full pixel density calculation.
- Calculate diagonal resolution using the formula
dₚ = √(w² + h²)
√(480² + 640²)
= √(230,400 + 409,600)
= √640,000
= 800 pixels
- Calculate PPI
PPI = 800 ÷ 5
= 160 PPI
This equals 160 pixels per linear inch.
- Calculate total pixel count
480 × 640 = 307,200 pixels
= 0.307 megapixels
This measures total resolution, not pixel density.
- Calculate dot pitch
Dot pitch (inches) = 1 ÷ 160
= 0.00625 inches
Convert to millimeters:
0.00625 × 25.4 = 0.15875 mm
≈ 0.1588 mm
A PPI of 160 was common in early smartphone display models, but modern smartphones often exceed 400 to 500 PPI, which significantly improves display sharpness and reduces visible pixelation at close viewing distance.
PPI vs DPI: Key Differences Explained
PPI vs DPI both describe density, but they apply to different technologies. PPI means pixels per inch and measures pixel density on digital screens. DPI means dots per inch and measures print resolution on paper. Both express how much detail fits within one inch, but they operate in different environments.
In digital space, a pixel is the smallest unit of an image. On screens, one pixel does not equal one physical dot. Each pixel usually contains three RGB subpixels: red, green, and blue. LCD display and OLED display panels use this RGB structure to create full color. DPI, by contrast, refers to physical ink dots placed by a printer.
PPI applies to screen sharpness and display technology. DPI applies to ink dot density in printing devices.
Subpixel layout also affects perceived sharpness. Most panels use a standard RGB stripe layout. Some OLED display panels use a PenTile matrix, where subpixel arrangement is uneven. This can slightly change visual clarity even when pixel density is identical. Viewing distance also influences how sharp a screen appears.
Many modern monitors range from 90 to 165 PPI. Smartphones often exceed 400 PPI, increasing perceived clarity at close distances.
RTINGS laboratory analysis explains that higher PPI increases perceived screen sharpness, while DPI applies primarily to printing devices and ink dot density.
Does PPI Really Matter? Screen Density Explained
PPI matters because pixel density directly affects screen sharpness. Higher PPI increases detail and reduces visible pixel edges. However, the visible benefit depends on viewing distance and human visual limits.
Viewing Distance & Retina Principle
The human eye has limited visual acuity. It is often approximated at about 1 arcminute of resolution. Beyond certain density and distance combinations, individual pixels become indistinguishable. This principle explains the Retina display concept. At typical viewing distance, increasing pixel density beyond a threshold produces minimal visible improvement.
Real Device Comparison
An iPhone XR has about 326 PPI. A 27 inch iMac 5K has about 218 PPI. The smartphone requires higher pixel density because it is viewed much closer to the eye. A desktop monitor sits farther away, so lower monitor PPI can still appear sharp.
For example, a 27 inch 4K monitor at 3840 × 2160 provides about 163 PPI, which many users find noticeably sharper than a 27 inch 1080p display at roughly 92 PPI.
Resolution Matching & Scaling
Higher pixel density alone does not guarantee optimal clarity. Geometry and resolution scaling also matter. The best case is 1:1 pixel mapping, where each image pixel matches one display pixel. Integer multiples or exact fractions also preserve clarity. Non integer scaling introduces display interpolation, which can soften text and images. Matching aspect ratio prevents distortion. If you need to calculate scaled resolutions for different displays, you can use our Resolution Scaling Calculator to quickly compute accurate output values.
Practical PPI Benchmarks
Below 110 PPI → Low density, common in 24 inch 1080p monitors
110–220 PPI → Medium to high density, typical for laptops and 1440p monitors
300+ PPI → Very high density, common in smartphones and tablets
Pixel density importance depends on viewing distance, resolution scaling, and device type, not just the number itself.
What Is a Good PPI? Pixel Density Categories Explained
A good PPI value depends on screen size and viewing distance. These pixel density categories come from Android density buckets. Android introduced these terms to keep UI scaling consistent across different screen sizes and display resolution standards.
Android Density Buckets
LDPI – 120 PPI – Low
MDPI – 120–160 PPI – Medium
TVDPI – 160–213 PPI – Medium High
HDPI / HiDPI – 213–240 PPI – High
XHDPI – 240–320 PPI – Extra High
XXHDPI – 320–480 PPI – Extra Extra High
XXXHDPI – 480–640 PPI – Extra Extra Extra High
These ranges were defined for interface scaling, not marketing labels. Modern smartphones typically fall in the XXHDPI range, and many premium devices exceed 450 PPI. Desktop monitors usually range between 90 and 165 PPI.
Under 110 PPI, pixels are easily visible. Around 160 PPI was common in early smartphones. Above 300 PPI, screen sharpness is high for handheld viewing. Laptops and desktop monitors often fall between 150 and 220 PPI depending on size and resolution.
PPI Chart: 24”, 27”, 32” at 1080p, 1440p, and 4K
| Screen Size | 1920×1080 (1080p) | 2560×1440 (1440p) | 3840×2160 (4K) |
|---|---|---|---|
| 24-inch | 91.8 PPI | 122.4 PPI | 183.5 PPI |
| 27-inch | 81.6 PPI | 108.8 PPI | 163.1 PPI |
| 32-inch | 68.8 PPI | 91.8 PPI | 137.6 PPI |
How to Calculate PPI for Any Monitor Size and Resolution
PPI, or pixels per inch, depends on two things: screen resolution and diagonal size. Monitor pixel density increases when resolution increases or when screen size decreases. Two monitors with the same resolution but different sizes will not have the same pixel density, which is why comparing screen dimensions, resolution, and viewing distance together using our Monitor Size Comparison Tool can help you choose the sharper setup. A larger screen spreads the same pixels over more space, which lowers display sharpness.
PPI Formula (Step-by-Step)
According to the standard pixel density formula described in Wikipedia’s Pixel Density reference, pixel density is calculated using the diagonal resolution and screen size.
Step 1: Calculate Diagonal Pixels
dₚ = √(width² + height²)
Where:
width = horizontal pixels
height = vertical pixels
This screen resolution formula is derived from the Pythagorean theorem and gives the diagonal resolution in pixels.
Step 2: Divide by Diagonal Size
PPI = dₚ ÷ diagonal (in inches)
For metric users, 1 inch equals 2.54 cm.
Technical note:
Dot pitch (mm) ≈ 25.4 ÷ PPI
Real Example – 24” 1080p vs 27” 1440p
Example 1: 24 inch, 1920 × 1080
Diagonal pixels:
√(1920² + 1080²) ≈ 2202.91
PPI:
2202.91 ÷ 24 ≈ 91.8 PPI
≈ 92 PPI
Dot pitch:
25.4 ÷ 92 ≈ 0.276 mm
Example 2: 27 inch, 2560 × 1440
Diagonal pixels:
√(2560² + 1440²) ≈ 2937.21
PPI:
2937.21 ÷ 27 ≈ 108.8 PPI
≈ 109 PPI
Dot pitch:
25.4 ÷ 109 ≈ 0.233 mm
The 27 inch 1440p PPI value is higher than the 24 inch 1080p PPI value. Higher PPI means smaller pixel spacing and improved display sharpness. At a typical desk distance of about 60–80 cm, many users notice clearer text when moving from about 92 PPI to around 109 PPI.
For reference, a 27 inch 4K monitor has about 163 PPI, which produces a significant increase in clarity. Professional designers often prefer monitors above 110 PPI because typography and UI scaling appear more refined at higher pixel density.
MacBook Retina Scaling vs Windows Scaling Explained
Both macOS and Windows use scaling to keep UI elements readable on high resolution monitors. As pixel density increases, icons and text would appear too small without scaling. However, the two systems implement HiDPI scaling differently. Retina displays focus on pixel-perfect mapping, while Windows relies on DPI-based percentage scaling.
How macOS Retina Scaling Works
MacBook Retina scaling uses pixel doubling, also called 2× scaling. The system renders the interface at a higher internal resolution and maps it cleanly to physical pixels.
Apple developer documentation explains that Retina scaling works by rendering content at a higher internal resolution and then scaling it to match the display’s pixel density for sharp output.
In macOS, logical resolution differs from physical resolution. For example, a 2560×1600 display may “look like” 1280×800 at 2× scaling. Each UI point is drawn using a 2×2 block of physical pixels. This pixel doubling ensures crisp text, no fractional scaling artifacts, and predictable rendering. macOS uses a coordinate system based on points instead of raw pixels.
How Windows Display Scaling Differs
Windows display scaling uses percentage-based DPI settings such as 100%, 125%, 150%, and 175%. Scaling depends on whether applications are DPI-aware.
Microsoft documentation explains that Windows uses DPI-aware scaling to adjust applications based on monitor pixel density, but apps must declare DPI awareness to render correctly.
Windows allows fractional scaling. If an application is not DPI-aware, the system may bitmap-scale it, which can cause blurry UI or inconsistent sizing. On a 27 inch 4K monitor at about 163 PPI, macOS typically applies clean 2× scaling, while Windows may use 150% scaling.
macOS uses a pixel-doubling model with predictable rendering optimized for Retina displays. Windows uses a DPI-aware scaling model that offers flexibility, especially in mixed-resolution multi-monitor setups. Windows introduced Per-Monitor DPI Awareness in Windows 8.1 and refined it in Windows 10 to improve handling of different pixel densities across displays.
Effective Resolution vs Physical Resolution Explained
Many users confuse native resolution with scaled resolution. Physical resolution refers to the actual pixel grid built into a display panel. Effective resolution refers to the “looks like” resolution after display scaling is applied. Understanding this difference is important for screen sharpness and UI clarity.
What Is Native (Physical) Resolution?
Native resolution is the fixed number of physical pixels in a panel. Every LCD, LED, or OLED screen contains a permanent pixel matrix. This panel pixel grid cannot change.
NVIDIA explains that native resolution maps directly to the panel’s fixed pixel grid, producing the sharpest possible image because each pixel in the signal corresponds to one physical pixel on the screen.
Native resolution delivers maximum clarity because it uses 1:1 pixel mapping. There is no interpolation and no scaling artifacts. A 1920×1080 monitor looks sharpest at 1920×1080. If set to 1600×900, the image must be stretched, which reduces sharpness.
Most modern displays cannot physically change their pixel count. Scaling only resizes the image across the same grid.
What Is Effective (Scaled) Resolution?
Effective resolution describes the usable workspace after scaling. It represents the logical UI size, not the actual pixel count.
For example, a 3840×2160 4K resolution display using 200% display scaling behaves like a 1920×1080 workspace. However, it still renders using all 8.29 million physical pixels.
Physical resolution remains 3840×2160. Effective resolution at 200% scaling equals roughly 1920×1080 workspace.
Scaling improves readability on high PPI screens and prevents tiny interface elements. To verify your display performance beyond resolution, you can also run our Refresh Rate Test to confirm your monitor’s real-time Hz output. Integer scaling such as 200% remains clean. Fractional scaling such as 150% may introduce minor interpolation artifacts.
A 27 inch 4K monitor at about 163 PPI running at 150% scaling provides a workspace similar to 2560×1440 while maintaining full 4K sharpness. Designers and video editors often work at native resolution to preserve pixel accuracy. For multi-drive storage setups used in 4K workflows, our RAID Calculator can help estimate usable capacity and redundancy levels.
Native resolution defines true pixel density. Effective resolution defines usable workspace.
Compare Popular Devices by PPI
| Device | Screen Size | Resolution | Pixel Density |
|---|---|---|---|
| 24” 1080p Monitor | 24-inch | 1920 × 1080 | ~92 PPI |
| 27” 1440p Monitor | 27-inch | 2560 × 1440 | ~109 PPI |
| 27” 4K Monitor | 27-inch | 3840 × 2160 | ~163 PPI |
| 14” Laptop 1080p | 14-inch | 1920 × 1080 | ~157 PPI |
| 6.1” Smartphone | 6.1-inch | 2556 × 1179 | ~460 PPI |
Pixel Density vs Screen Real Estate Trade-Off
Increasing pixel density improves monitor sharpness. Increasing screen real estate improves usable workspace. These two goals often move in opposite directions. Choosing the right monitor PPI requires balancing screen clarity with comfortable UI size.
Higher PPI vs Larger UI Elements
Higher PPI produces sharper text and images. Edges appear smoother, and fine details render more accurately. However, high pixel density often requires display scaling to keep interface elements readable.
Scaling enlarges UI elements. Enlarged UI reduces effective resolution and usable workspace.
For example, a 27 inch 1080p monitor provides about 82 PPI, and if you’re experimenting with scaled rendering resolutions, you can measure the impact using our resolution scaling calculator. It offers large workspace at 100% scaling but lower screen clarity. A 27 inch 4K monitor provides about 163 PPI, which significantly improves monitor sharpness. At 100% scaling, UI elements appear very small. At 150% scaling, the effective resolution becomes similar to 2560×1440 workspace.
The trade-off is clear. You gain higher PPI and sharper output, but you may not gain additional usable desktop area.
Physical resolution does not equal usable resolution. High resolution without proper UI scaling can reduce readability. Lower resolution may feel more comfortable for some users depending on viewing distance.
Finding Your Readability Sweet Spot
The readability sweet spot represents the ideal balance between clarity and comfort. It depends on viewing distance, screen size, eyesight, and work type.
• 90–110 PPI → comfortable at 100% scaling for typical desktop monitors
• 140–170 PPI → balanced clarity at 125–150% scaling
• 200+ PPI → requires scaling; excellent clarity but reduced workspace
Programmers and writers often prioritize readability and crisp text. Designers and video editors benefit from higher pixel density for detailed work. If you’re also optimizing system responsiveness for creative workloads, our RAM Latency Calculator can help analyze memory timing impact on performance. Spreadsheet users may prefer more visible rows and columns over maximum sharpness.
Human visual acuity limits how much benefit higher PPI provides at normal desk distance. Operating systems recommend adjusting scaling instead of lowering resolution to preserve sharp rendering.
The best PPI is not the highest value available. For more PC hardware calculators and performance tools, visit Bottleneck Calculator Online. It is the one that balances screen clarity with comfortable UI size for your viewing distance and workflow.
PPI vs Viewing Distance Explained
Pixel density only matters in relation to how far you sit from the screen. The human eye can resolve limited detail at a given distance, so higher PPI provides diminishing returns as viewing distance increases.
At around 2 to 3 feet (60–90 cm), a display near 90 PPI typically appears acceptable for general desktop use. This is why a 24 inch 1080p monitor at about 92 PPI remains common in office environments.
Around 150 to 170 PPI looks noticeably crisper at standard desk distance. Text edges appear cleaner and fine UI elements render more sharply. This is typical of 27 inch 4K monitors (~163 PPI) and many laptops.
Pixel densities above 300 PPI are primarily beneficial when the screen is viewed very close, such as smartphones held 20–30 cm from the eyes. At that range, higher density reduces visible pixel structure. At normal monitor distance, 300+ PPI provides minimal additional clarity for most users.
Can the Human Eye See Above 300 PPI?
The answer depends on viewing distance and human visual limits. The Retina concept is based on the idea that pixels become indistinguishable once they are smaller than the eye can resolve at a normal viewing distance.
Human visual acuity is often approximated at about 1 arcminute of angular resolution. That means the eye can distinguish details that subtend roughly 1/60th of a degree. When pixel spacing falls below this threshold relative to viewing distance, individual pixels become invisible.
At typical smartphone distance, around 25 to 30 cm, pixel densities near or above 300 PPI approach this visibility threshold. This is why many phones use 400 to 500+ PPI. At that distance, higher density reduces visible pixel edges.
For desktop monitors viewed at 60 to 80 cm, the pixel visibility threshold occurs at much lower density. In that range, 150 to 180 PPI already exceeds what most users can resolve. Increasing to 400+ PPI on a monitor would provide minimal visible improvement because angular resolution limits are already reached.
High pixel density improves screen clarity up to the point where pixels become indistinguishable. Beyond that threshold, additional PPI does not produce meaningful gains at normal viewing distance.
Higher PPI = Higher GPU Demand?
Higher PPI usually increases when resolution increases, not just when screen size changes. While higher resolution improves display sharpness, competitive gaming performance also depends on low input latency and stable network delay, so before upgrading hardware for esports titles, you can verify your real-time connection stability using our Valorant Ping Test.
Pixel density rises because more pixels are packed into the same physical space. However, the GPU does not render based on PPI directly. It renders based on total pixel count.
More pixels mean more rendering load. A graphics card must calculate color, lighting, shadows, and textures for every pixel on the screen. When resolution increases, the total number of pixels increases significantly.
For example:
2560 × 1440 = 3.69 million pixels
3840 × 2160 (4K) = 8.29 million pixels
4K resolution renders more than twice as many pixels as 1440p. Running higher resolutions also increases overall system power draw, so it’s worth verifying PSU capacity with our PSU Wattage Calculator before upgrading to a high-end GPU. This substantially increases GPU workload and reduces frame rates if hardware remains the same.
Higher PPI often accompanies higher resolution, and higher resolution directly increases GPU demand. If you want to estimate how resolution changes affect gaming performance, try our FPS Calculator to check expected frame rates with your current hardware. Screen sharpness improves, but performance cost also increases.
Visual Comparison: Pixel Density Differences
The images above show how pixel density changes visual clarity.
At lower PPI, individual pixels and subpixel structure become easier to see when viewed closely. Edges may appear jagged and text can look slightly rough.
At higher PPI, pixels are packed more tightly together. This reduces visible pixel spacing and improves screen sharpness. Fine details and text rendering appear smoother.
Although higher density increases clarity, the visible difference depends on viewing distance. At normal desk distance, moderate pixel density may already exceed the eye’s resolution threshold.
FAQs
Does viewing distance change how sharp a monitor looks?
Yes. Screen sharpness depends on both pixel density and viewing distance. The human eye has limited angular resolution, often approximated at about 1 arcminute. As viewing distance increases, pixels occupy a smaller visual angle and become harder to distinguish. A 92 PPI monitor may look sharp at 80 cm, but the same monitor may look pixelated at 40 cm.
How do I calculate perceived PPI based on viewing distance?
Perceived sharpness depends on angular resolution. A simplified approximation uses visual acuity limits:
Perceived threshold PPI ≈ 3438 ÷ viewing distance (in inches)
For example, at 24 inches viewing distance:
3438 ÷ 24 ≈ 143 PPI
Above this value, individual pixels are typically indistinguishable for users with normal vision.
Is 27-inch 4K usable at 100% scaling?
A 27-inch 4K monitor has about 163 PPI. At 100% scaling, UI elements appear very small for most users at desk distance. Many users apply 125% or 150% display scaling for comfortable readability while maintaining sharp rendering.
Does scaling reduce image clarity or just change UI size?
It depends on scaling type. Integer scaling such as 200% maintains sharpness because of clean pixel mapping. Fractional scaling such as 125% or 150% may introduce minor interpolation artifacts. Modern operating systems minimize blur, but clarity can vary between applications.
Should I use 125% or 150% scaling on a 4K monitor?
For a 27-inch 4K display (~163 PPI), 150% scaling often provides balanced readability and effective resolution similar to 2560×1440 workspace. 125% offers more usable workspace but may reduce comfort for extended reading. The optimal choice depends on eyesight and viewing distance.
How does farsightedness affect ideal monitor PPI?
Farsighted users often benefit from larger UI elements rather than maximum pixel density. Higher PPI improves edge smoothness, but readability depends more on scaling and text size adjustments. Increasing scaling percentage is generally more effective than lowering resolution.
Why does a 27” 1440p monitor look less sharp than a 24” 1440p?
Both displays share the same resolution, but the 27-inch panel spreads pixels over a larger area. A 24-inch 1440p monitor has about 122 PPI, while a 27-inch 1440p monitor has about 109 PPI. Higher pixel density results in tighter pixel spacing and improved monitor sharpness.
Is 4K overkill on a 27-inch monitor?
A 27-inch 4K display provides about 163 PPI, which is noticeably sharper than 1440p (~109 PPI). However, the benefit depends on viewing distance and scaling preferences. At normal desk distance, clarity improvement is visible, but GPU demand and scaling requirements should also be considered.