
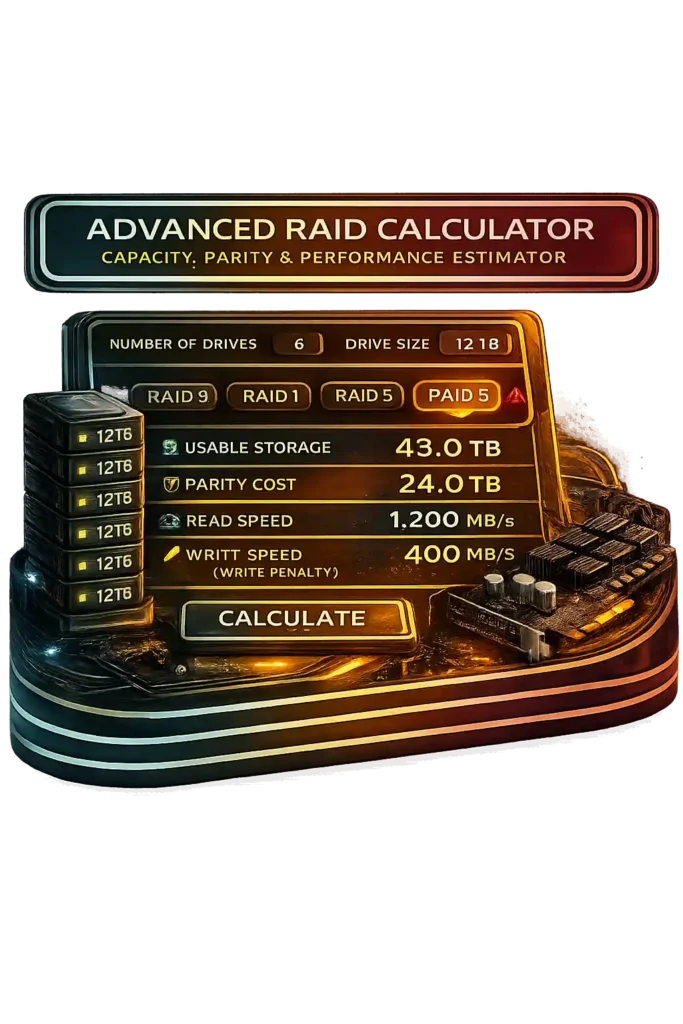
I use this RAID calculator when I want clear numbers before building an array. It works as a RAID capacity calculator and RAID storage estimator. It calculates usable storage, parity cost, and RAID failure tolerance using real RAID performance calculation logic.
This RAID calculator calculates:
- RAID usable storage after parity
- RAID parity calculation for RAID 5 and RAID 6
- RAID 5 capacity formula and RAID 6 usable space
- RAID write penalty impact
- Estimated read and write performance
- RAID rebuild risk with large drives
- TB vs TiB difference in final capacity
You can enter:
- Number of drives
- Drive size, even uneven sizes
- RAID level: 0, 1, 5, 6, 10
It factors rebuild time, which can exceed 24 hours with 16TB to 20TB drives. Enterprise drives show 1 error per 10¹⁴ bits, while consumer drives show 1 per 10¹³ bits, affecting rebuild safety.
And yes, RAID does not replace backup. Calculations follow standard formula based array math for realistic results.
How To Use Advanced RAID Calculator Video
What Is a RAID Capacity Calculator?
I see many people guess their storage space. That usually ends badly. A RAID capacity calculator is a storage planning tool. It estimates RAID usable storage, parity calculation impact, and drive failure tolerance before you build the array. It helps with RAID redundancy planning so you do not overestimate space.
According to the Storage Networking Industry Association, RAID combines multiple disks into a logical unit for performance, redundancy, or both. That idea started in 1988 when Patterson, Gibson, and Katz published the UC Berkeley RAID paper. Modern RAID logical disk array systems still follow that same foundation.
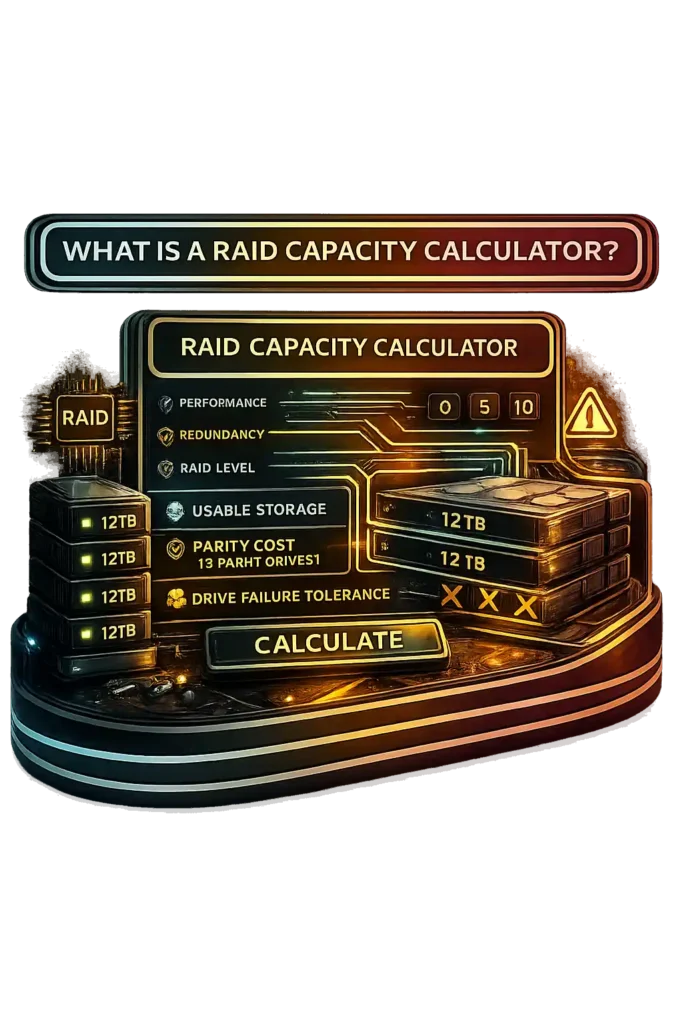
This RAID capacity calculator estimates:
- Total raw capacity
- RAID usable storage after parity or mirroring
- Parity overhead percentage
- Drive failure tolerance
- Basic performance impact
It models outcomes using array math. It does not create redundancy itself. And RAID reduces usable space by design, not because a drive failed. Also, RAID does not replace backup.
What Exactly Does a RAID Calculator Calculate?
I like to break it down simply. A RAID calculator shows the real numbers before you commit.
It calculates:
- Total raw drive capacity
- RAID usable space calculation
- RAID 5 parity overhead and RAID 6 parity cost
- RAID failure tolerance calculation
- RAID write penalty
- RAID performance estimation
- TB vs TiB RAID adjusted space
Results change based on RAID level, number of drives, and the smallest drive in the array. RAID 5 parity overhead equals one full drive. RAID 6 uses two. Enterprise drives often show a URE rate of 1 error per 10¹⁴ bits, while consumer drives show 1 per 10¹³ bits. With 16TB or larger drives, rebuild times can exceed 24 to 48 hours, increasing risk during rebuild.
Why PC Builders & Power Users Need a RAID Calculator
I have seen people build arrays and then realize they lost more space than expected. That hurts. A RAID calculator helps PC users plan smarter.
Why it matters:
- Avoid storage miscalculations
- Compare RAID 0 vs 1 vs 5 vs 10
- Plan RAID for gaming PC setups
- Design RAID for NAS builds
- Estimate workstation usable capacity
- Understand RAID performance vs capacity trade-offs
- Prevent costly rebuild mistakes
RAID 0 gives performance but zero redundancy. RAID 5 uses one full drive for parity. Many users forget that. Modern NVMe SSDs on PCIe 4.0 or 5.0 exceed 7,000 MB per second, which often removes the need for RAID 0 in gaming builds.
Honestly, a RAID calculator keeps RAID storage planning realistic before you spend money. If you’re planning a full PC build alongside storage upgrades, check overall hardware balance using our PC Bottleneck Calculator before finalizing components.
What Is RAID in a PC System?
I see RAID in PC builds all the time, especially when someone wants more speed or safety. RAID in PC means combining multiple drives into one RAID array. The system treats them like one big drive. The goal is simple. You either want a RAID performance boost, PC storage redundancy, or both.
A RAID configuration works through a motherboard controller or through the operating system. Many consumer motherboards support RAID 0, 1, and 10 using chipset firmware. RAID first appeared in 1988 in a UC Berkeley paper. Today, gaming PCs, NAS systems, and workstations use it often. But RAID is not a backup. If data deletes, RAID will not save it.
Now let’s break down what RAID actually means.
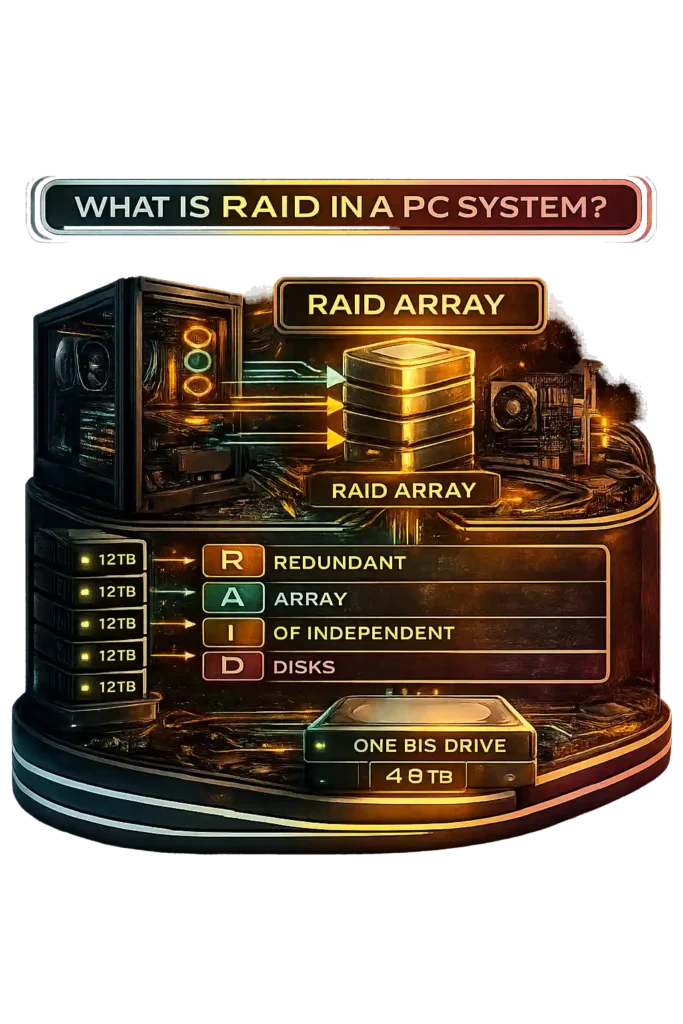
RAID Meaning: Redundant Array of Independent Disks
RAID full form is Redundant Array of Independent Disks. Redundant means fault tolerance. Array means multiple drives grouped together. Independent Disks means separate physical drives working as one logical disk array. The Storage Networking Industry Association defines RAID as combining disks into a single logical unit for performance or redundancy. The older term used “Inexpensive” instead of “Independent.” RAID storage meaning forms the base of modern enterprise storage systems.
Hardware RAID vs Software RAID: What’s the Difference?
I usually tell people it comes down to control and cost.
Hardware RAID:
- Uses a hardware RAID controller or RAID card
- Offloads processing from the CPU
- Often includes onboard cache memory
- Common in enterprise servers
- Higher cost
Software RAID:
- Managed by the operating system
- Uses system CPU for processing
- Lower cost
- Flexible and easy to modify
- Often called motherboard RAID
Modern CPUs reduce the RAID performance difference between hardware RAID and software RAID. For most home PC builds, software or chipset RAID works just fine.
RAID Levels Explained With Usable Capacity Formulas
I always check RAID levels before building an array. RAID levels explained simply means how data gets split across drives. Some use striping for speed. Some use mirroring for safety. Some use parity distribution for fault tolerance. Each RAID level changes usable capacity, performance, and failure protection.
Red Hat enterprise documentation explains RAID level behavior, parity distribution, and minimum disks for RAID types. Dell Technologies enterprise RAID guides confirm RAID capacity formula rules. RAID 5 usable space equals (N − 1) × smallest drive. RAID 6 capacity calculation equals (N − 2) × smallest drive. The smallest drive always limits total usable size. RAID 5 requires minimum disks for RAID of 3. RAID 6 requires 4. Parity adds write penalty, which affects performance.
Now let’s break down each RAID level clearly.
RAID 0 – Maximum Performance, Zero Redundancy
RAID 0 uses striping only. It splits data evenly across drives for speed. There is no redundancy.
- RAID 0 formula: Usable = N × smallest drive
- Minimum drives: 2
- Failure tolerance: 0 drives
- RAID 0 performance: Scales with drive count
One drive failure causes total data loss. RAID 0 capacity looks great, but RAID 0 failure risk is high. I would only use it for scratch disks or temporary workloads.
RAID 1 – Disk Mirroring for Redundancy
RAID 1 mirroring copies identical data to each drive. It focuses on RAID 1 redundancy, not capacity.
- RAID 1 usable capacity: Equals smallest drive
- Minimum drives: 2
- RAID 1 drive failure: 1 drive per mirror pair
- Read speed improves, write speed stays normal
Rebuild is a simple copy process. RAID 1 rebuild risk stays lower than parity RAID.
RAID 5 – Distributed Single Parity
RAID 5 combines striping with RAID 5 parity. Parity blocks distribute across all drives.
- Minimum drives: 3
- RAID 5 capacity formula: (N − 1) × smallest drive
- RAID 5 usable space: One drive worth used for parity
- Failure tolerance: 1 drive
Parity calculation creates RAID write penalty. RAID 5 rebuild risk increases with 12TB to 20TB drives. Enterprise drives show about 1 error per 10¹⁴ bits during rebuild, which matters for large arrays.
RAID 6 – Dual Parity for Higher Fault Tolerance
RAID 6 double parity protects against two drive failures.
- Minimum drives: 4
- RAID 6 formula: (N − 2) × smallest drive
- RAID 6 usable capacity: Two drives worth for parity
- RAID 6 fault tolerance: 2 drives
Write penalty is higher than RAID 5. RAID 6 fits large enterprise arrays where rebuild risk must stay lower.
RAID 10 (1+0) – Mirroring and Striping Combined
RAID 10 combines RAID 1 redundancy with RAID 0 striping. It mirrors pairs, then stripes across them.
- Minimum drives: 4
- RAID 10 formula: (N ÷ 2) × smallest drive
- Failure tolerance: 1 per mirror pair
- RAID 10 performance: High read and write speed
RAID 10 has no parity write penalty. Rebuild is faster and safer than RAID 5 or RAID 6 because no parity reconstruction happens.
How RAID Capacity Is Calculated (Formula Breakdown)
I always start with the math before building any array. RAID usable storage calculation depends on three core variables. The RAID capacity formula changes based on drive count and RAID level. RAID storage math follows fixed logical rules.
RAID usable capacity depends on:
- Number of drives N
- Smallest drive limitation
- RAID level selected
- Parity or mirroring overhead
All drives are limited to the smallest drive size. Larger drives do not increase usable space beyond that limit. Parity and mirroring reduce usable capacity by design. Dell enterprise documentation confirms RAID 5 = N − 1 and RAID 6 = N − 2 for usable drives. These formulas are theoretical. Real usable space is slightly lower due to formatting and TB vs TiB conversion.
1 TB equals 1,000,000,000,000 bytes.
1 TiB equals 1,099,511,627,776 bytes.
That difference alone can reduce displayed capacity by about 7 to 10 percent. Filesystem overhead can reduce another 1 to 5 percent.
Now let’s break down each RAID capacity formula clearly.
RAID 0 Usable Capacity Formula
Formula:
Usable Capacity = N × Smallest Drive Size
RAID 0 capacity formula uses full combined storage. No RAID parity formula applies here. No mirroring either.
Minimum drives required: 2
Failure tolerance: 0 drives
Example:
4 × 2TB = 8TB usable space theoretically
RAID 0 usable space equals 100 percent of total storage. Real-world RAID 0 storage calculation shows slightly less after formatting.
RAID 1 Usable Capacity Formula
Formula:
Usable Capacity = Smallest Drive Size
RAID 1 capacity formula mirrors data across drives. Storage efficiency equals 50 percent for a two-drive mirror.
Minimum drives required: 2
Failure tolerance: 1 drive per mirror pair
Example:
2 × 4TB drives → 4TB usable space
RAID 1 usable space equals one drive because data duplicates. RAID 1 storage efficiency trades space for redundancy. Rebuild requires direct copy. No parity recalculation needed.
RAID 5 Usable Capacity Formula
Formula:
Usable Capacity = N − 1 × Smallest Drive Size
RAID 5 capacity formula uses one drive worth of space for RAID 5 parity overhead.
Minimum drives required: 3
Failure tolerance: 1 drive
RAID write penalty applies due to parity calculation
Example:
4 × 4TB → 3 × 4TB = 12TB usable space
RAID 5 usable space looks efficient, but rebuild risk increases with large 12TB or bigger drives. Enterprise drives typically show about 1 error per 10¹⁴ bits, which impacts RAID 5 rebuild reliability.
RAID 6 Usable Capacity Formula
Formula:
Usable Capacity = N − 2 × Smallest Drive Size
RAID 6 capacity formula reserves two drives for RAID 6 double parity.
Minimum drives required: 4
Failure tolerance: 2 drives
Higher write penalty than RAID 5
Example:
6 × 2TB → 4 × 2TB = 8TB usable storage
RAID 6 usable storage reduces capacity but increases protection. RAID 6 double parity fits large 12TB to 20TB arrays where dual fault tolerance matters.
RAID 10 (1+0) Usable Capacity Formula
Formula:
Usable Capacity = N ÷ 2 × Smallest Drive Size
RAID 10 capacity formula mirrors pairs, then stripes across them.
Minimum drives required: 4
Storage efficiency: 50 percent
Failure tolerance: 1 drive per mirror pair
No parity write penalty
Example:
6 × 2TB → 3 × 2TB = 6TB usable space
RAID 10 usable space equals half total capacity. RAID 10 storage calculation sacrifices space for speed and safety. Rebuild runs faster than RAID 5 or RAID 6 because no parity reconstruction occurs.
RAID Performance Comparison: Read vs Write Speeds
I always look at read and write numbers separately. RAID read performance often scales with the number of drives because of striping. RAID write performance changes depending on parity overhead. Sequential speeds and random speeds behave differently. System responsiveness also depends on memory timing, which you can calculate using our RAM Latency Calculator.
RAID speed comparison:
- RAID 0 → Fastest RAID read performance and RAID write performance. Scales with N drives.
- RAID 1 → Strong read speed. Write speed similar to a single drive.
- RAID 5 → Good read speed. Slower writes due to parity calculation.
- RAID 6 → Good reads. Slower writes than RAID 5 because of dual parity.
- RAID 10 → High read speed and strong write speed. No parity penalty.
Controller quality, SSD vs HDD, and workload type affect RAID performance scaling. SSD RAID benefits less from scaling because controllers can bottleneck. A single PCIe 4.0 NVMe drive can exceed 7,000 MB per second, which reduces the need for RAID 0 in many PCs.
RAID 0 vs RAID 5 speed differences matter most under heavy writes.
Which RAID Level Delivers the Highest Speed?
RAID 0 delivers the fastest RAID level for pure throughput. RAID 0 speed scales almost linearly in sequential workloads.
RAID 10 performance offers the best balance of speed and redundancy. For random reads and mixed workloads, RAID 10 often performs stronger than parity RAID.
RAID 5 and RAID 6 slow down writes because of parity overhead. The fastest setup depends on workload type. Sequential workloads favor RAID 0. Random or mixed workloads often favor RAID 10. And performance gains show diminishing returns as drive count increases due to controller and bus limits.
Understanding RAID Write Penalty
RAID write penalty means extra I O operations required to update parity data. Parity write overhead increases write latency.
According to enterprise storage explanations referenced by Tom’s Hardware, RAID 5 4 I O penalty means four operations per write. RAID 6 6 I O penalty means six operations per write.
For RAID 5:
- Read old data
- Read old parity
- Write new data
- Write new parity
For RAID 6, extra parity calculations add more steps.
RAID write penalty impacts small random writes more than large sequential writes. Databases and virtualization workloads feel this more. RAID 10 has no parity write penalty. Hardware RAID controllers with onboard cache can reduce perceived RAID performance impact.
RAID 0 vs RAID 1 vs RAID 5 vs RAID 10 – Side-by-Side Comparison
This RAID comparison table shows RAID capacity comparison, RAID performance comparison, and RAID fault tolerance chart details in one place.
| RAID Level | Min Drives | Usable Capacity Formula | Fault Tolerance | Read Speed | Write Speed | Best For |
|---|---|---|---|---|---|---|
| RAID 0 | 2 | N × smallest drive | 0 drives | Very High | Very High | Performance-only workloads |
| RAID 1 | 2 | Smallest drive | 1 drive | High | Normal | Simple redundancy |
| RAID 5 | 3 | (N − 1) × smallest drive | 1 drive | High | Moderate (write penalty 4 I/O) | Balanced storage |
| RAID 10 | 4 | (N ÷ 2) × smallest drive | 1 per mirror pair | Very High | High | Performance + redundancy |
Storage efficiency insight:
RAID 0 = 100% efficiency
RAID 1 = 50% efficiency
RAID 5 ≈ (N−1)/N efficiency
RAID 10 = 50% efficiency
RAID 0 vs RAID 5 speed favors RAID 0 for raw speed. RAID 1 vs RAID 10 shows RAID 10 gives stronger performance. RAID 5 saves more space but rebuild risk increases with large 12TB+ drives, so RAID 10 often feels safer for big arrays.
How Many Drives Can Fail in Different RAID Levels?
RAID failure tolerance means how many drives can fail before data loss occurs. This number depends entirely on RAID level and array design. It also determines overall RAID rebuild risk.
Enterprise documentation from NetApp confirms RAID 1 tolerates 1 failure per mirror pair, RAID 5 disk failure limit is 1 drive, and RAID 6 double disk failure protection allows 2 concurrent failures.
Here is the breakdown:
- RAID 0 → 0 drives. Any single failure causes total data loss.
- RAID 1 → 1 drive per mirror pair.
- RAID 5 → 1 drive.
- RAID 6 → 2 drives.
- RAID 10 → 1 drive per mirror pair. Multiple failures are possible if they occur in different pairs.
If two drives fail in the same mirror pair in RAID 10, data loss happens. Rebuild windows increase exposure risk, especially with 12TB to 20TB drives. Enterprise drives show about 1 error per 10¹⁴ bits during rebuild, which raises probability of failure in RAID 5 arrays.
RAID protects against hardware failure. It does not protect against accidental deletion or ransomware.
Now let’s look at this in chart form.
RAID Failure Tolerance Comparison Chart
| RAID Level | Minimum Drives | Drives That Can Fail | Data Safe After Failure? | Risk Level |
|---|---|---|---|---|
| RAID 0 | 2 | 0 | No | Very High |
| RAID 1 | 2 | 1 per mirror | Yes | Low |
| RAID 5 | 3 | 1 | Yes | Moderate |
| RAID 6 | 4 | 2 | Yes | Lower |
| RAID 10 | 4 | 1 per mirror pair | Yes (if not same pair) | Low |
RAID 6 vs RAID 5 reliability shows RAID 6 offers stronger standard protection. RAID 10 rebuild safety remains higher than RAID 5 because it avoids parity reconstruction. Large arrays can take 24 to 48 hours to rebuild, increasing exposure during that period, and extended rebuild time also increases power consumption, which you can estimate using our Electricity Cost Calculator for long-term storage cost planning.
Is RAID Worth It for a Gaming PC?
I see many gamers ask if RAID for gaming PC setups will boost performance. Most want faster load times or more storage for large game libraries. So the real question is simple. Does RAID improve FPS or just storage speed?
Pros:
- RAID 0 gaming performance increases sequential speeds
- RAID 1 adds redundancy for large game collections
- RAID 10 gives performance plus protection
- Useful for large gaming SSD RAID storage pools
Cons:
- Minimal FPS improvement in most games
- RAID 0 increases failure risk
- Modern NVMe drives already extremely fast
- Setup and rebuild process more complex
Most games are GPU bound. Storage speed rarely changes frame rate, and if you want to verify how your monitor handles high frame output in real time, you can run our Refresh Rate Test to measure actual display refresh behavior. RAID vs NVMe gaming tests usually show similar FPS. For most gamers, a single fast NVMe drive is enough. RAID mainly improves load times, not gameplay smoothness.
If you experience lag in online games, the issue is usually network latency rather than storage speed — so it’s worth checking your connection using our Valorant Ping Test before upgrading drives. To see what actually impacts gaming performance, estimate frame rates using our FPS Calculator instead of relying on storage upgrades for FPS gains.
Does RAID 0 Improve SSD Gaming Performance?
Yes, RAID 0 SSD gaming can double sequential throughput in theory. SSD striping gaming setups increase total bandwidth.
It helps with large file transfers and game installs. RAID 0 load time improvement can appear in very large open world titles. But in-game FPS barely changes. Random small reads stay close to single NVMe performance because SSD latency remains similar.
RAID 0 vs single NVMe often shows diminishing returns due to motherboard PCIe lane limits and controller overhead.
And one SSD failure means total data loss. That risk is real.
Why Modern NVMe Drives Often Remove the Need for RAID
NVMe vs RAID changes the discussion. NVMe connects directly through PCIe lanes. It delivers very low latency and high IOPS.
- Single PCIe 4.0 SSD speed exceeds 7,000 MB per second
- PCIe 5.0 NVMe performance reaches 10,000 to 14,000 MB per second
- Most game engines never saturate that bandwidth
- RAID unnecessary for gaming in most cases
NVMe gaming performance already exceeds what most titles require. DirectStorage reduces CPU overhead, but it benefits more from a fast single NVMe than a RAID array. Higher rendering resolutions impact performance more than storage speed, which you can estimate using our Resolution Scaling Calculator.
RAID still makes sense for capacity or redundancy. But for pure gaming speed, modern NVMe usually wins.
Choosing RAID for NAS and Professional Workstations
When I plan RAID for NAS or workstation RAID configuration, I focus on uptime and data integrity first. NAS systems store data long term. Professional workstations need sustained speed under heavy load.
For NAS:
- Prioritize redundancy and long-term storage
- Common setups: RAID 5 or RAID 6
- RAID 6 safer for large 8TB to 20TB drives
- Large drives increase rebuild risk
- Rebuild time can exceed 24 to 48 hours under load
Enterprise drives often show about 1 error per 10¹⁴ bits. That increases risk in RAID 5 during rebuild.
For Workstations:
- Prioritize speed plus redundancy
- Common choice: RAID 10
- Heavy write workloads like editing or VM storage
- Faster rebuild than parity RAID
RAID 6 works well for large enterprise RAID setup arrays. RAID 10 fits performance driven workstations better. If you’re adding multiple drives to your system, confirm total power requirements using our PSU Wattage Calculator.
Which RAID Level Offers the Best Data Protection?
RAID 6 provides the highest standard fault tolerance among common RAID levels. RAID 6 vs RAID 10 reliability depends on workload.
RAID 6 tolerates two drive failures. RAID 10 offers strong redundancy and faster rebuild. RAID 1 remains simple and reliable for small systems. RAID 5 offers moderate protection but becomes riskier with large capacity drives.
Protection ranking:
- RAID 6 → highest fault tolerance, 2 drives
- RAID 10 → strong redundancy plus fast rebuild
- RAID 1 → simple mirroring
- RAID 5 → moderate protection
RAID 10 rebuilds faster than parity RAID because it mirrors instead of recalculating parity blocks. But RAID redundancy comparison must include one rule. RAID protects hardware failure only. It does not replace backup.
Best RAID Configuration for Video Editing and Large Workflows
RAID for video editing must handle large sequential transfers. 4K and 8K footage requires sustained throughput.
4K ProRes or RAW files can exceed 400 to 1,000 MB per second, and when working with frame-accurate editing timelines you can convert precise video time values using our Timecode to Frame Converter. Storage must keep up.
Requirements:
- High sequential read and write speed
- Large file handling
- Stable sustained performance
RAID 0 gives maximum speed but high risk. RAID 5 improves capacity but slower writes due to parity. RAID 10 provides strong balance for RAID storage for creators.
NVMe RAID arrays deliver higher throughput than SATA RAID. For production media environments, RAID 10 usually makes the most sense, especially when working with high-resolution media where screen sharpness and pixel density can be evaluated using our Pixel Density Calculator.
Important: RAID Is Not a Backup Solution
RAID is not backup. RAID protects against drive failure only.
Backblaze clearly states RAID vs backup difference. RAID does not protect against accidental deletion, ransomware, file corruption, fire, theft, or disaster. RAID maintains uptime. It does not provide historical recovery.
RAID does not protect against:
- Accidental file deletion
- Ransomware encryption
- File corruption
- Physical damage or theft
A proper data backup strategy follows the 3 2 1 backup rule. Keep 3 copies, use 2 media types, and store 1 copy offsite.
RAID redundancy helps availability. Backup protects your data history. Both matter.
RAID Calculator Example: Step-by-Step Capacity Calculation
I’ll walk through a simple RAID capacity example so you can see the RAID storage math clearly. This shows how to calculate RAID storage manually before using any RAID calculator. These numbers are theoretical and do not include filesystem overhead.
Steps to calculate usable RAID capacity:
- Identify number of drives (N).
- Identify smallest drive size.
- Select RAID level.
- Apply correct RAID capacity formula.
- Adjust for TB vs TiB if needed.
Enterprise RAID calculators always base math on the smallest drive size. Also remember, an advertised 4TB drive usually shows about 3.63 TiB inside the operating system. Real usable space will be 1 to 5 percent lower due to formatting.
Now let’s look at two practical examples.
Example: 4 × 4TB Drives in RAID 5
Scenario:
4 drives, each 4TB. RAID 5 selected.
Formula:
Usable = (N − 1) × smallest drive
Calculation:
(4 − 1) × 4TB = 12TB usable (theoretical)
RAID 5 4x4TB calculation uses one full drive for parity. RAID 5 usable storage example shows 1 drive worth lost to RAID 5 parity overhead example.
Failure tolerance equals 1 drive. After TB to TiB conversion, the OS will show roughly 10.9 to 11 TiB. Real-world usable space will be slightly lower after formatting. Rebuild risk increases while replacing a failed drive in larger arrays.
Example: 6 × 2TB Drives in RAID 10
Scenario:
6 drives, each 2TB. RAID 10 selected.
Formula:
Usable = (N ÷ 2) × smallest drive
Calculation:
(6 ÷ 2) × 2TB = 6TB usable (theoretical)
RAID 10 6x2TB example shows half total capacity used for mirroring. RAID 10 capacity calculation sacrifices 50 percent storage for redundancy.
Failure tolerance equals 1 drive per mirror pair. RAID 10 usable storage example provides high read and write performance. RAID 10 rebuild is a direct mirror copy, which reduces parity reconstruction risk compared to RAID 5 or RAID 6.
Common Mistakes When Calculating RAID Capacity
I see RAID calculation mistakes all the time. Many users overestimate RAID usable space and end up buying the wrong number of drives. RAID storage miscalculation leads to poor planning and unexpected capacity loss.
Common RAID planning mistakes include:
- Mixing different drive sizes
- Ignoring smallest drive limitation
- Confusing TB vs TiB display differences
- Underestimating rebuild risks on large drives
Enterprise administrators always calculate using the smallest drive and include parity overhead before purchasing hardware. Small math errors can change total usable capacity by terabytes.
Now let’s break these down clearly.
Mistake #1: Mixing Uneven Drive Sizes
RAID mixed drive sizes cause wasted capacity. Standard RAID follows the RAID smallest drive rule. Every drive aligns to the smallest disk in the array.
Example:
4TB + 4TB + 8TB in RAID 5
The system treats all drives as 4TB. The extra 4TB on the larger drive remains unused.
Uneven drives RAID setups reduce efficiency. Most systems do not automatically combine extra space. Enterprise systems may allow advanced configurations, but typical RAID uses smallest drive capacity. For maximum efficiency, always use identical drive sizes.
Mistake #2: Ignoring the Smallest Drive Rule
RAID smallest drive limitation applies to all RAID formulas. Even one smaller disk reduces total array capacity.
Example:
3 × 4TB + 1 × 2TB in RAID 5
Usable = (4 − 1) × 2TB
Usable = 6TB
Even though three drives are 4TB, the 2TB disk limits everything. RAID formula smallest drive math always applies. RAID uneven disk capacity creates large usable space errors. Replacing the smaller drive later may require a full rebuild to expand capacity.
Mistake #3: Confusing TB and TiB
TB vs TiB difference causes RAID usable space discrepancy. Western Digital explains manufacturers use decimal units.
1 TB = 10¹² bytes
1 TiB = 2⁴⁰ bytes or 1,099,511,627,776 bytes
Operating systems report storage in TiB. A 4TB drive typically shows about 3.63 TiB. This RAID capacity difference is normal. It is not missing space.
Decimal vs binary storage creates roughly 7 to 10 percent lower displayed capacity. When calculating RAID usable space, always consider TB vs TiB conversion before assuming loss.
Mistake #4: Ignoring Rebuild Time and Large Drive Risks
RAID rebuild time increases with large drives. A 16TB or larger disk can take 24 to 48 hours or more to rebuild depending on workload.
Seagate enterprise guidance explains URE risk RAID 5 concerns. Enterprise drives show about 1 Unrecoverable Read Error per 10¹⁴ bits read. During RAID 5 rebuild, the system must read all remaining drives. If a URE occurs, RAID 5 rebuild failure can happen.
Large drive RAID risk increases as capacity grows. RAID 6 safer than RAID 5 for 12TB to 20TB drives because it tolerates two failures. Rebuild also stresses remaining disks, increasing chance of a second failure during recovery.
RAID vs JBOD: Key Differences Explained
I see people confuse RAID vs JBOD difference all the time. Both connect multiple drives into one storage setup. But the way they handle data is completely different.
IBM storage documentation defines JBOD storage configuration as independent disks grouped together without redundancy or striping. That means JBOD does not use RAID structured data distribution like striping, mirroring, or parity.
Here’s a clear comparison:
| Feature | RAID | JBOD |
|---|---|---|
| Data Distribution | Structured (striping, parity, mirroring) | None |
| Redundancy | Yes (except RAID 0) | No |
| Performance Boost | Possible | No |
| Failure Protection | Depends on level | None |
| Capacity Efficiency | Depends on RAID level | 100% total capacity |
JBOD vs RAID performance differs because RAID can improve speed and add fault tolerance. JBOD simply aggregates disks. If one JBOD disk fails, only that disk’s data is lost. RAID 0 can lose all data if one drive fails.
JBOD is often used for backup targets or cold storage. RAID requires controller logic. JBOD can function without RAID firmware.